




Understanding Support and Resistance in Crypto Trading
Introduction
When you look at a crypto price chart, you may notice that prices sometimes stop falling near a particular area and start rising again. Similarly, prices may struggle to move higher after reaching certain levels.
Traders often study these areas using two important concepts: support and resistance.
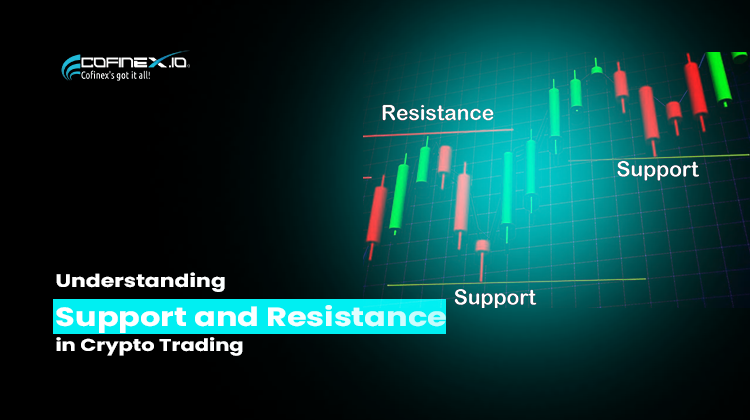
Support is a price area where buying interest may slow a decline. In contrast, resistance is a price area where selling interest may slow a price increase.
However, neither level guarantees that the price will reverse. Market conditions can change, and prices can break through both support and resistance.
In this lesson, you’ll learn how these levels work, how traders identify them, and what beginners should understand before using them.
What Is Support in Crypto Trading?
Support is a price area where buying interest may increase enough to slow or temporarily stop a price decline.
For example, imagine Bitcoin falls towards ₹80,00,000. Buyers begin purchasing near that area, and the price starts moving upward.
If the price reacts similarly around that area on several occasions, traders may identify it as a support zone.
However, support does not mean the price cannot fall further. If selling pressure becomes stronger than buying interest, the price may break below the zone.
Why Does Support Form?
Several factors can contribute to support:
- Buying interest: Some traders consider an asset attractive when its price reaches a particular area.
- Previous price reactions: Traders may watch areas where the price previously stopped falling or bounced upward.
- Market psychology: Round numbers and widely watched price levels can influence trading decisions.
- Trading activity: Increased buying activity around a price area may help slow a decline.
As a result, traders often watch support zones to understand how the market responds to falling prices.
What Is Resistance in Crypto Trading?
Resistance is a price area where selling interest may increase enough to slow or temporarily stop a price rise.
For example, suppose Bitcoin rises towards ₹85,00,000. Some traders sell near that area, and the price begins to fall.
If the market shows similar reactions around that area repeatedly, traders may identify it as a resistance zone.
Nevertheless, resistance does not guarantee a price decline. If buying demand becomes strong enough, the price may break above the zone.
Why Does Resistance Form?
Resistance can develop for several reasons:
- Selling interest: Some traders may choose to sell when the price reaches a particular level.
- Previous price reactions: Traders often watch areas where earlier price increases slowed or reversed.
- Profit-taking: Traders who bought at lower prices may sell to realise profits.
- Market psychology: Widely watched price levels can attract buying and selling activity.
Therefore, resistance zones can help traders identify areas where the market may face selling pressure.
Support vs Resistance: Key Differences
| Feature | Support | Resistance |
|---|---|---|
| Location | Often below the current price | Often above the current price |
| Market pressure | Buying interest may slow a decline | Selling interest may slow an advance |
| Possible reaction | Price may bounce upward | Price may pull back downward |
| Breakout direction | Price may break below support | Price may break above resistance |
| Reliability | Not guaranteed to hold | Not guaranteed to hold |
Remember that support and resistance represent price areas, not fixed barriers. Their significance depends on market conditions and price behaviour.
A Simple Example of Support and Resistance
Imagine a cryptocurrency trades between ₹100 and ₹120 for several days.
During this period:
- The price falls towards ₹100 and then rises several times.
- The price climbs towards ₹120 and then falls several times.
Traders may interpret ₹100 as a support zone and ₹120 as a resistance zone.
If the price approaches ₹100 again, traders may watch whether buying interest appears. Similarly, when the price approaches ₹120, they may observe whether selling pressure increases.
However, the price could break below ₹100 or above ₹120 at any time. Therefore, traders should not assume that the same pattern will continue indefinitely.
How Do Traders Identify Support and Resistance?
Traders use several methods to identify potential support and resistance zones.
1. Look at Previous Price Reactions
First, examine the price chart and look for areas where the price repeatedly stopped falling or rising.
For example, several upward reactions near a similar price may suggest a potential support zone.
Likewise, repeated downward reactions near a similar price may indicate possible resistance.
2. Identify Price Zones, Not Just Exact Numbers
Support and resistance rarely work as perfectly precise lines.
Instead, traders often mark a zone that covers several nearby price reactions. This approach recognises that buying and selling activity can occur across a range of prices.
3. Observe Trading Volume
Trading volume shows how much of an asset traders exchange during a particular period.
Some traders examine volume when the price approaches a support or resistance zone. A change in volume may provide additional context, although volume alone cannot confirm whether a level will hold or break.
4. Use Different Timeframes
A price area that matters on a short-term chart may not carry the same significance on a longer-term chart.
For this reason, traders sometimes compare multiple timeframes to understand the broader price structure.
However, no timeframe guarantees a more accurate outcome.
What Happens When Support or Resistance Breaks?
Sometimes, the price moves through a support or resistance zone instead of reversing.
Support Breaks
When the price moves below support, it may indicate that selling pressure has increased. Some traders then watch whether the price continues falling or returns above the zone.
In certain situations, a broken support zone may later act as resistance.
Resistance Breaks
When the price moves above resistance, it may indicate stronger buying pressure. Traders may then watch whether the price continues rising or falls back below the zone.
In some cases, a broken resistance zone may later act as support.
This behaviour is often called role reversal. However, it does not happen every time, and a brief move beyond a level may turn out to be a false breakout.
Common Beginner Mistakes
Treating levels as guarantees: Support can break, and resistance can fail.
Drawing too many lines: Marking every small price movement can make a chart confusing. Focus on meaningful price reactions instead.
Ignoring market conditions: News, volatility, liquidity, and broader market trends can influence how prices behave around these zones.
Assuming every breakout will continue: Some breakouts reverse quickly. Traders should consider the wider market context.
Relying on one signal alone: Support and resistance provide context, but they do not predict future prices with certainty
FAQs
What is support in crypto trading?
Support is a price area where buying interest may slow a decline or encourage a temporary upward reaction.
What is resistance in crypto trading?
Resistance is a price area where selling interest may slow a price increase or encourage a temporary downward reaction.
Can support become resistance?
Yes. After the price breaks below a support zone, that zone may act as resistance if the price later returns to it. However, this behaviour is not guaranteed.
Can resistance become support?
Yes. When the price breaks above resistance, that zone may later act as support if the price returns to it.
Is support and resistance enough to make a trading decision?
No. These concepts help traders interpret price behaviour, but they cannot guarantee an outcome. Traders should also consider risk management, market conditions, and other relevant information.
Disclaimer
This article is for educational purposes only and does not provide financial or investment advice. Cryptocurrency markets are volatile, and support and resistance levels can fail. Always understand the risks before making trading decisions.